How to Read a Camera Histogram in Photography
By Ian Middleton · Travel & landscape photographer
The Most Reliable Exposure Tool — and How to Use It
When it comes to getting exposure right in photography, your eyes can deceive you. The brightness of your camera’s rear LCD shifts depending on how much ambient light surrounds you — what looks perfectly exposed in a dim room can turn out badly overexposed when you review it on a proper screen. Learning how to read a histogram changes that completely.
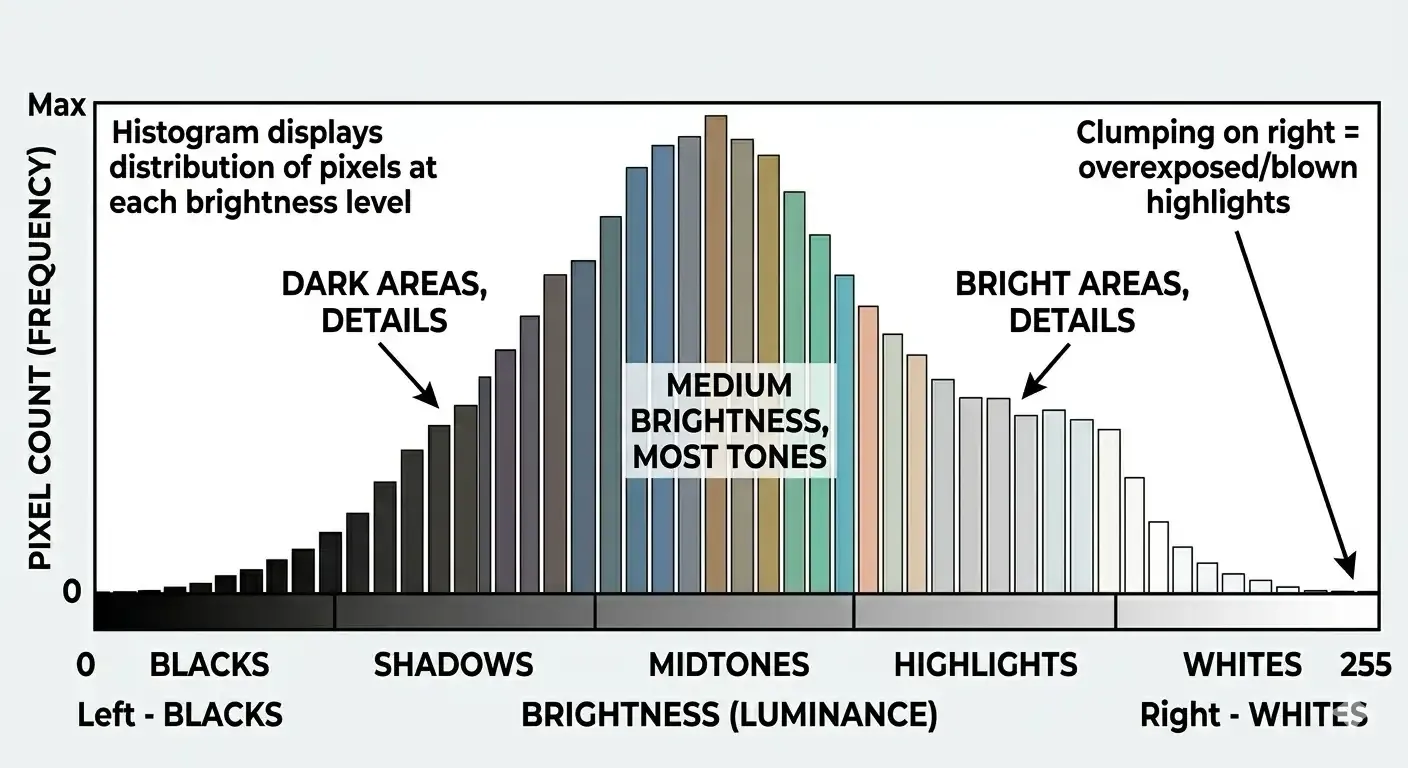
A camera histogram is a graph that shows the complete tonal distribution of your image — from pure black on the far left to pure white on the far right, with every shade of grey and midtone in between. The height of the graph at any point represents how many pixels in your image fall at that brightness level. It gives you an objective, numerical picture of your exposure that no screen preview can match.
Once you know how to read a histogram in photography, you’ll never need to guess whether a shot is correctly exposed again.
What Is a Histogram in Photography?
A histogram is a bar graph of brightness values. Every pixel in your image has a brightness value somewhere between 0 (pure black) and 255 (pure white). The histogram plots all of those values simultaneously, so you can see at a glance whether your image is dominated by dark tones, bright tones, or a balanced mix of both.
Think of it as the science behind the photo. The image preview on your camera shows you what the scene looks like — the histogram shows you whether the camera has actually captured it accurately. These two things are not always the same.
Unlike the LCD preview, which changes in appearance depending on the ambient light around you, the histogram is objective. It shows the same data whether you’re in a dark studio or shooting in bright midday sun. That’s what makes it the most reliable exposure tool available to any photographer — beginner or professional.
How to Read a Camera Histogram
The horizontal axis represents brightness — dark tones on the left, bright tones on the right. The vertical axis represents the number of pixels at each brightness level.
- Left side (shadows): Pixels here are very dark or black. A large spike on the far left indicates large areas of deep shadow in your image.
- Middle (midtones): The centre represents the mid-grey tones — skin tones, green foliage, blue sky. A well-exposed general scene will often have a healthy spread through the middle.
- Right side (highlights): Pixels here are very bright or white. A large spike on the far right indicates bright areas — a white shirt, a clear sky, sunlit snow, a candle flame.
There is no single “correct” histogram shape. A dramatic silhouette at sunset will push most tones to the left and right simultaneously and look stunning. What matters is whether the histogram matches your creative intent.
That said, there are two clear warning signals every photographer needs to know: highlight clipping and shadow clipping.
What Is Highlight Clipping in Photography?
Highlight clipping — sometimes called “burning out” or “blown-out highlights” — occurs when areas of your image become so bright that they exceed what the sensor can record. These areas are rendered as pure, featureless white with no tonal information whatsoever. No texture, no detail, no colour. They are gone, and in most cases they cannot be recovered — even from a RAW file.
On the histogram, highlight clipping is unmistakable: the graph is cut off hard against the right edge, as if it has been pushed off the chart. The taller the spike against the right edge, the more significant the clipping.
Common situations where highlight clipping occurs include:
- Bright skies photographed behind a shaded subject
- Snow or white sand in direct sunlight
- Candles, flames, or artificial lights included in the frame
- Specular reflections on water, glass, or metal
- White clothing in bright outdoor light
Why Blown-Out Highlights Are Such a Problem
A small area of clipping — a distant light source, a tiny specular reflection — is often acceptable or unavoidable. But clipping across large, prominent areas destroys irreplaceable visual information. In landscape photography, a blown-out sky looks artificial. In portraits, overexposed skin appears harsh. In product photography, clipped highlights remove all sense of depth.
And unlike underexposure — where lifting shadows in editing often yields usable results — blown-out highlights in a JPEG are unrecoverable. Even in RAW, severely clipped highlights rarely recover cleanly. Detect and prevent highlight clipping before you shoot.
How to Fix Clipped Highlights
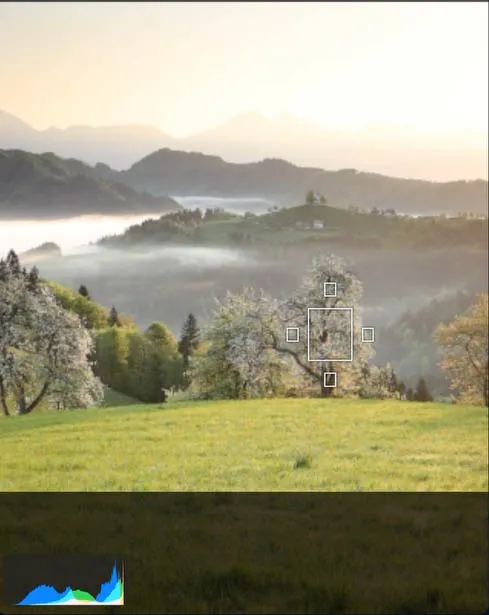
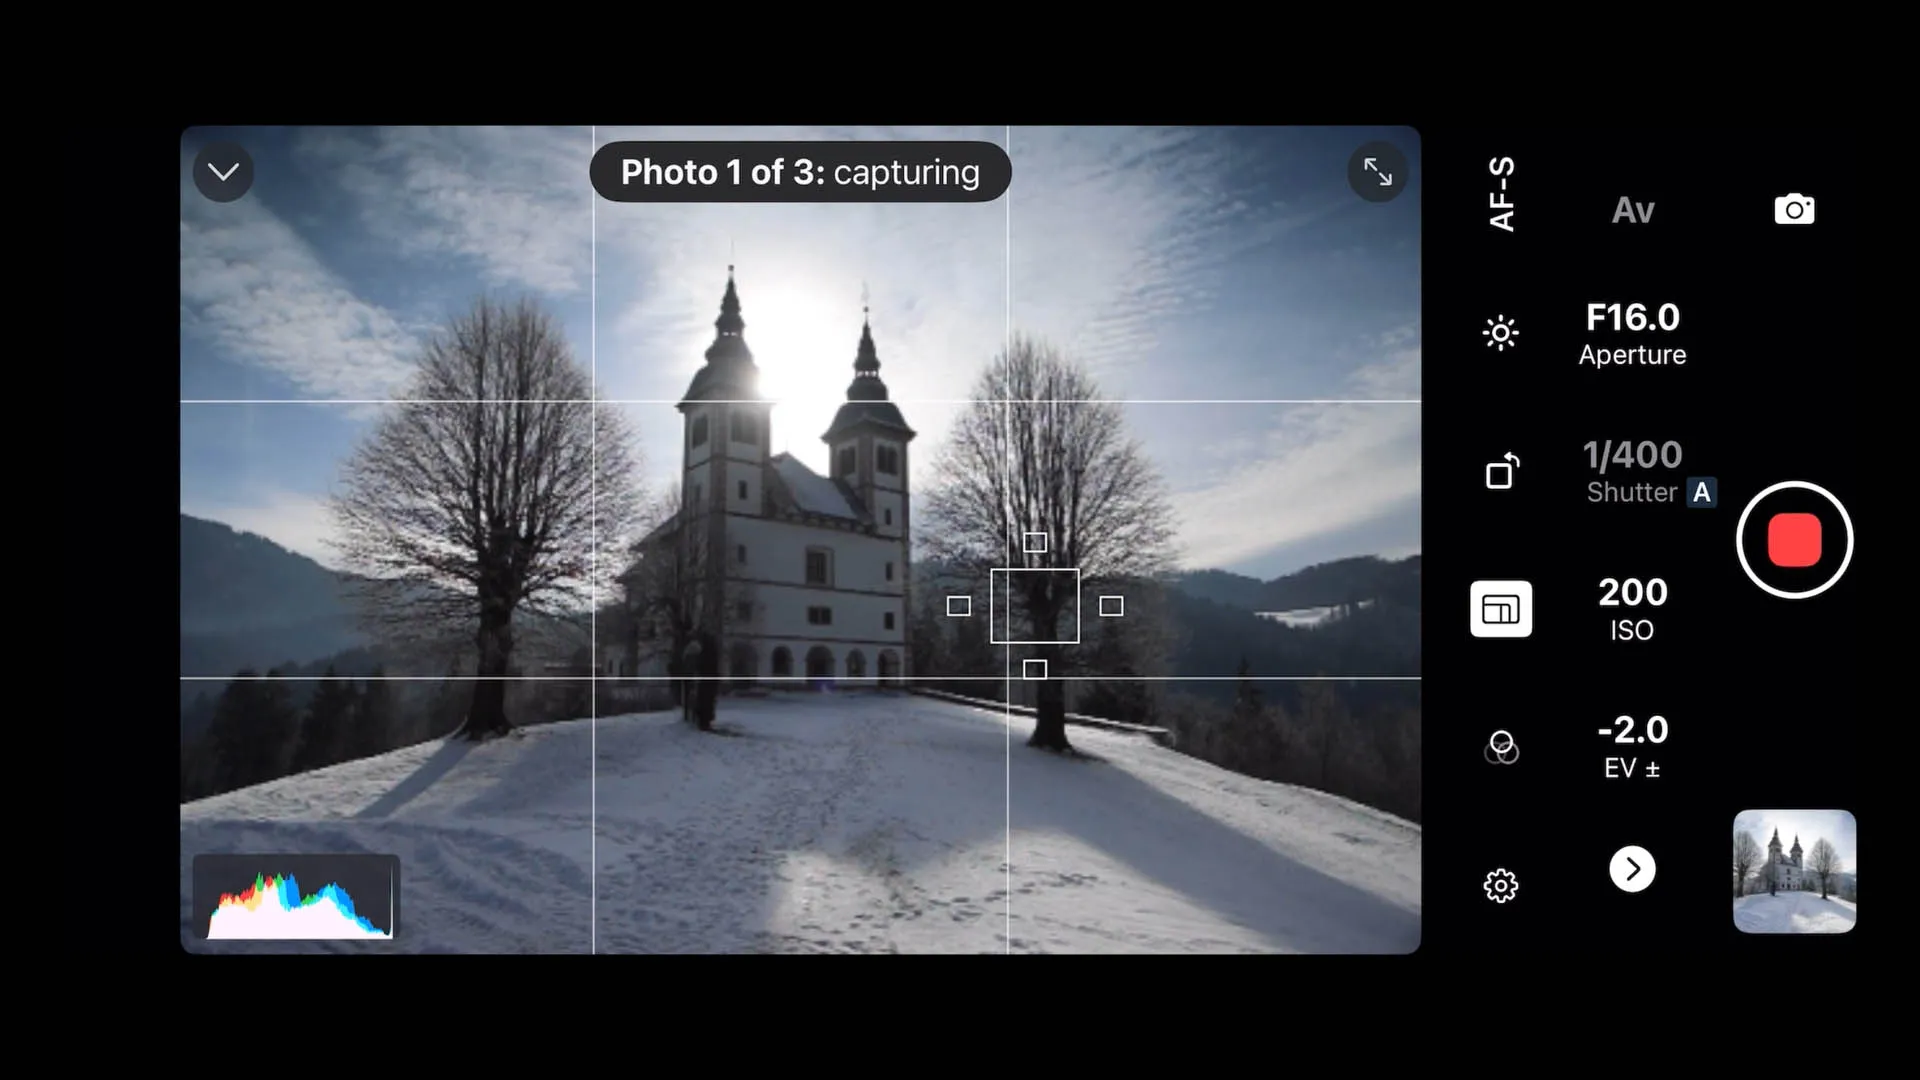
On the histogram, watch the right edge. If there is a visible spike jammed against it, clipping is occurring. To correct it, reduce your exposure — use a faster shutter speed, close your aperture, reduce your ISO, or dial in negative exposure compensation — until that spike drops away from the right edge.
In Shutter+, you can watch the histogram respond in real time as you adjust exposure compensation, giving you instant feedback before you take the shot.
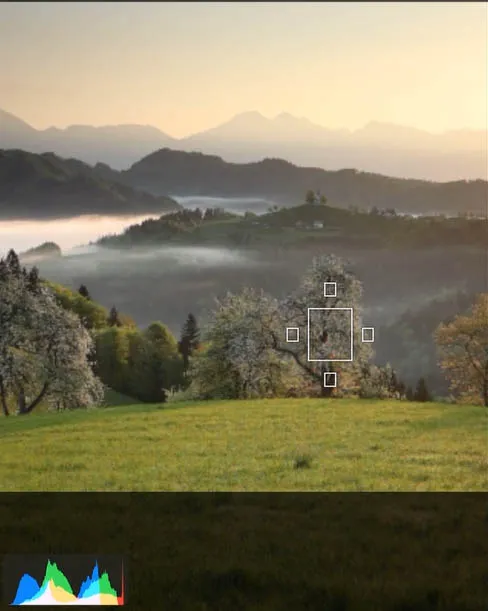
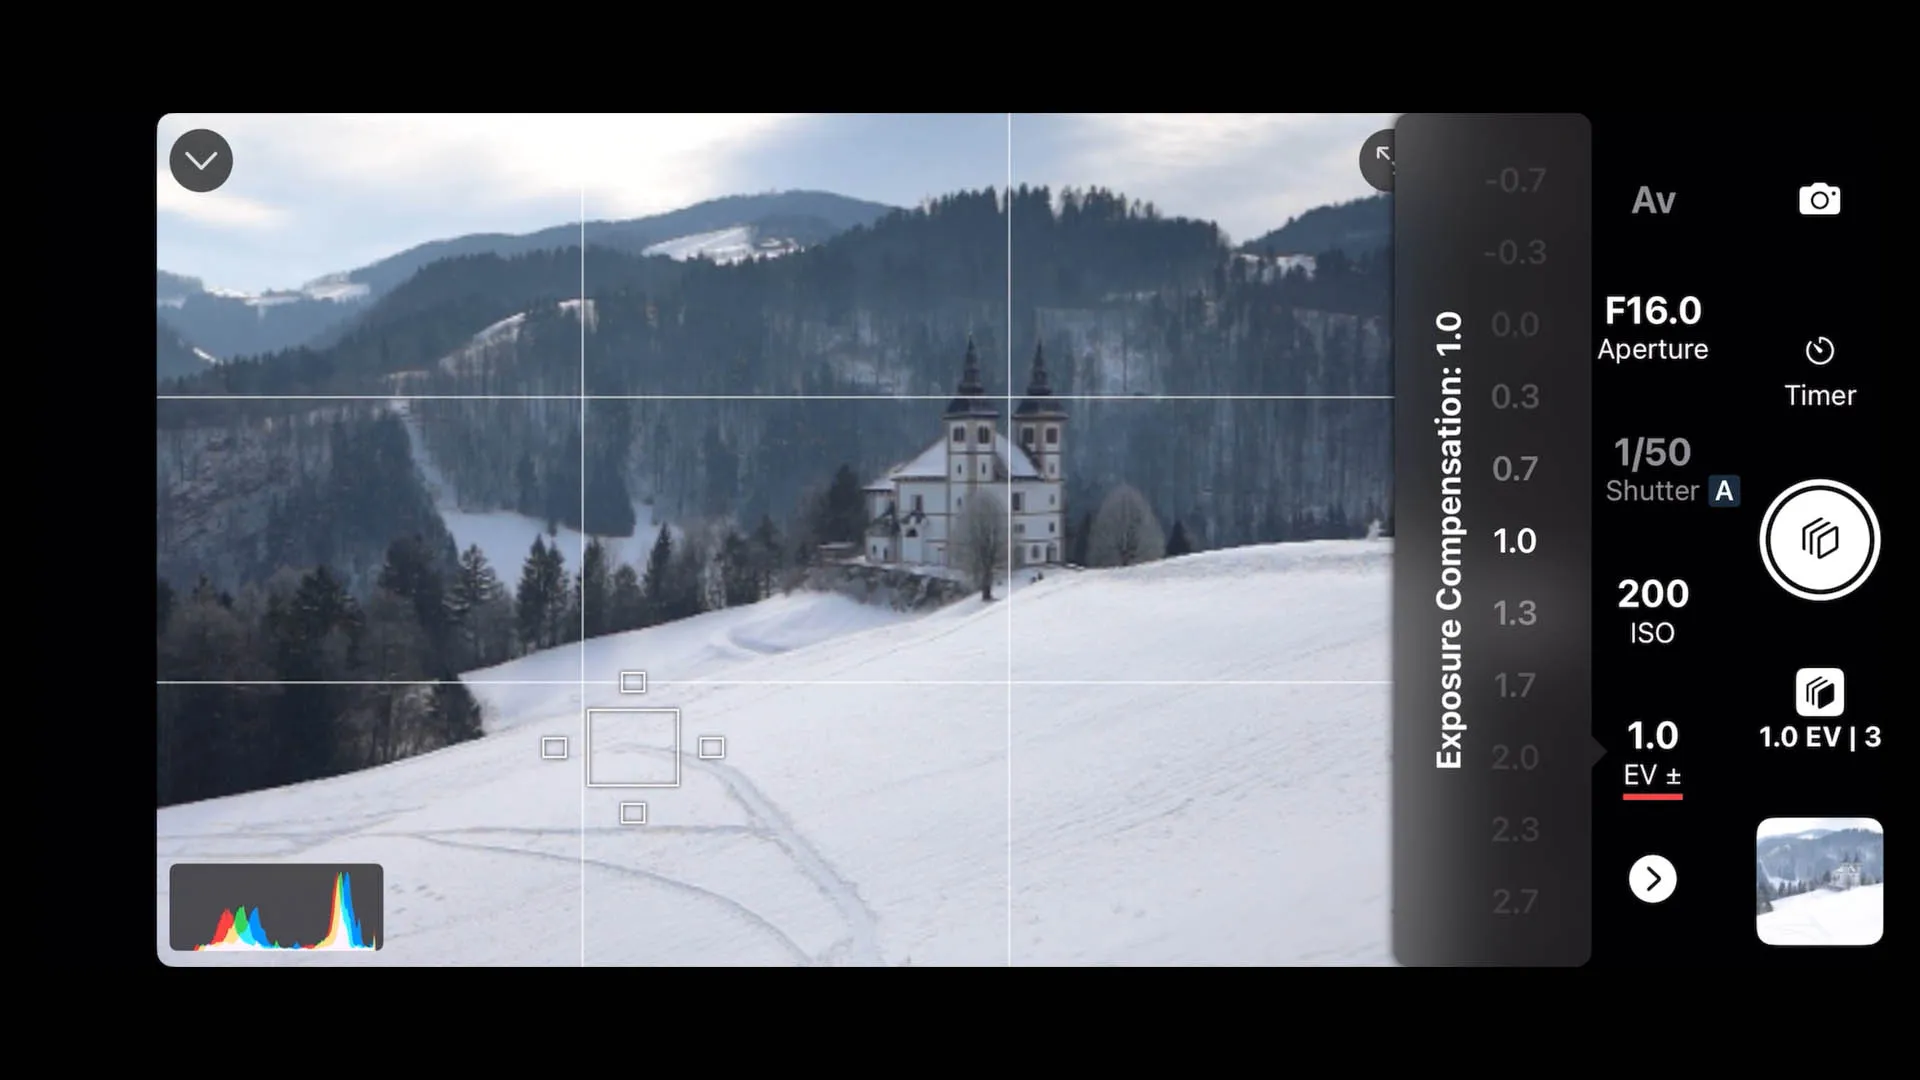
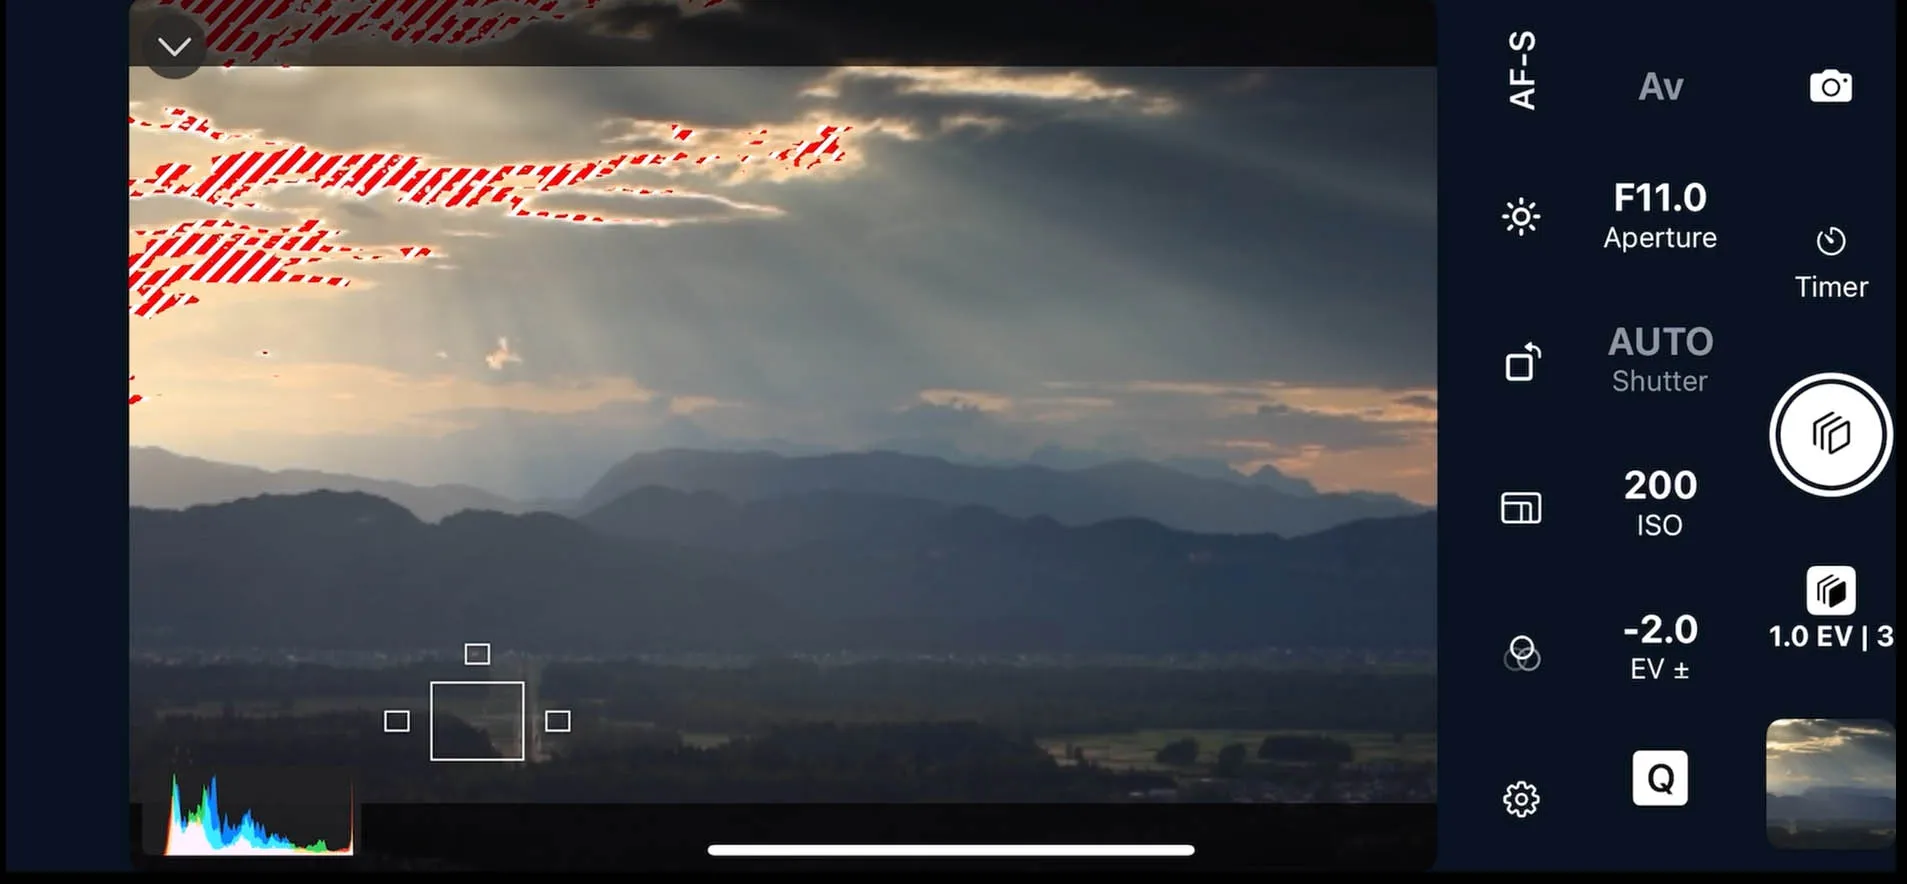
Here the exposure is better, and although you can still see a spike (which is the bright part of the sky in the top right corner) it’s not pushed right up to the edge, indicating that detail is preserved.
What Is Shadow Clipping in Photography?
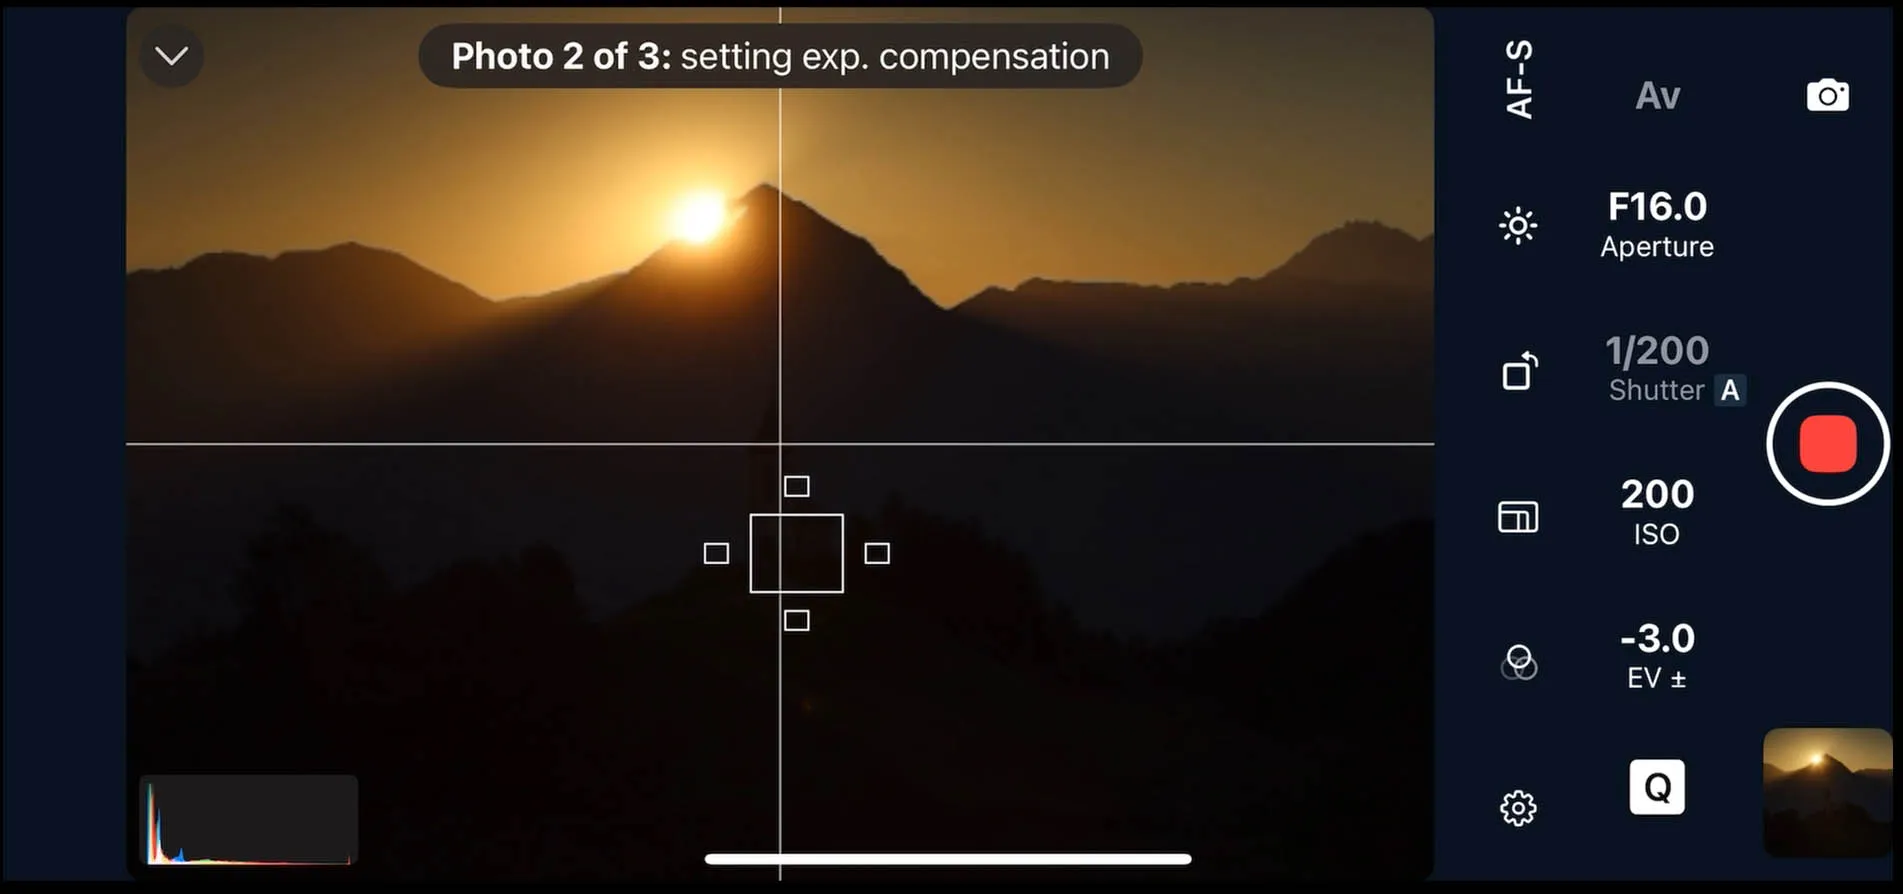
Shadow clipping is the inverse of highlight clipping. It occurs when areas of your image fall below the minimum value the sensor can record, and are captured as pure black with no recoverable detail. On the histogram, this appears as a spike against the left edge of the graph.
Like blown highlights, heavily clipped shadows lose all texture and information — a dark interior becomes a flat black void, a subject in shade loses definition, foreground details in a landscape disappear.
When Shadow Clipping Is a Problem — and When It’s Creative Intent
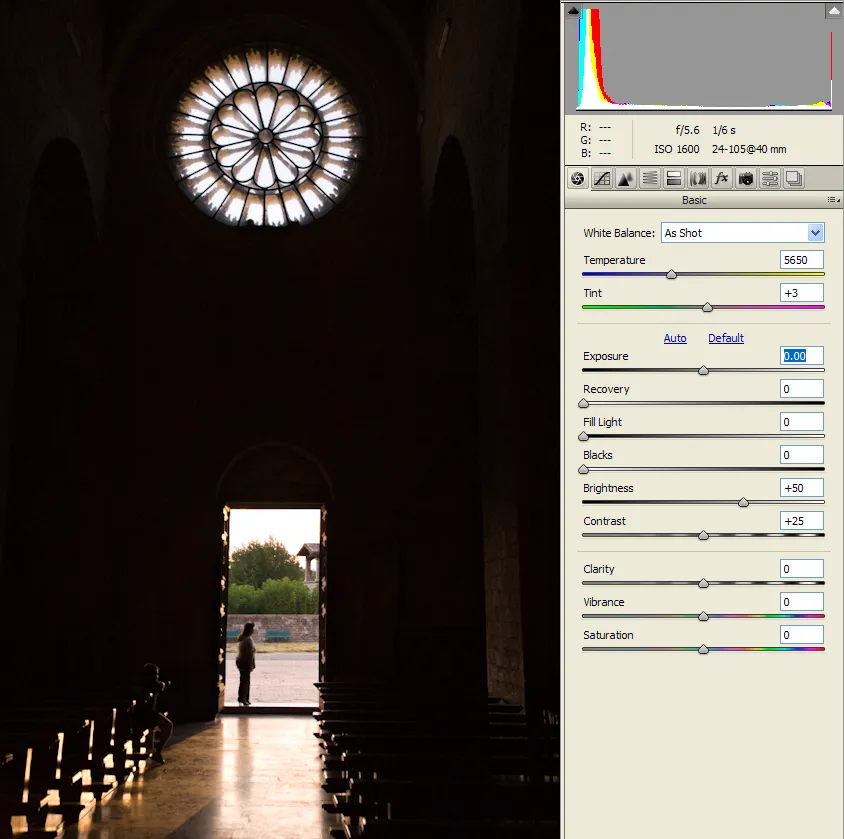
Shadow clipping is often more forgiving than highlight clipping, and sometimes it’s entirely intentional. High-contrast portraits, backlit subjects, and moody night scenes often rely on pure black shadows for their visual impact. Shadow clipping is only a technical problem when you intended to retain detail in areas that have clipped.
To recover shadow detail, increase your exposure: use a slower shutter speed, open your aperture, raise your ISO, or dial in positive exposure compensation.
Balancing Highlights and Shadows: Understanding Dynamic Range
Every scene has a brightness range from its darkest point to its brightest. Your camera can only capture a finite number of stops of light — its dynamic range. In high-contrast scenes, you may face a choice: protect the highlights, or expose for shadow detail. The histogram shows you both extremes simultaneously, letting you make an informed decision. If spikes appear at both edges, the scene exceeds your sensor’s dynamic range — options include a compromise exposure, exposure bracketing, or a deliberate creative choice.
How to Use the Histogram to Determine Correct Exposure
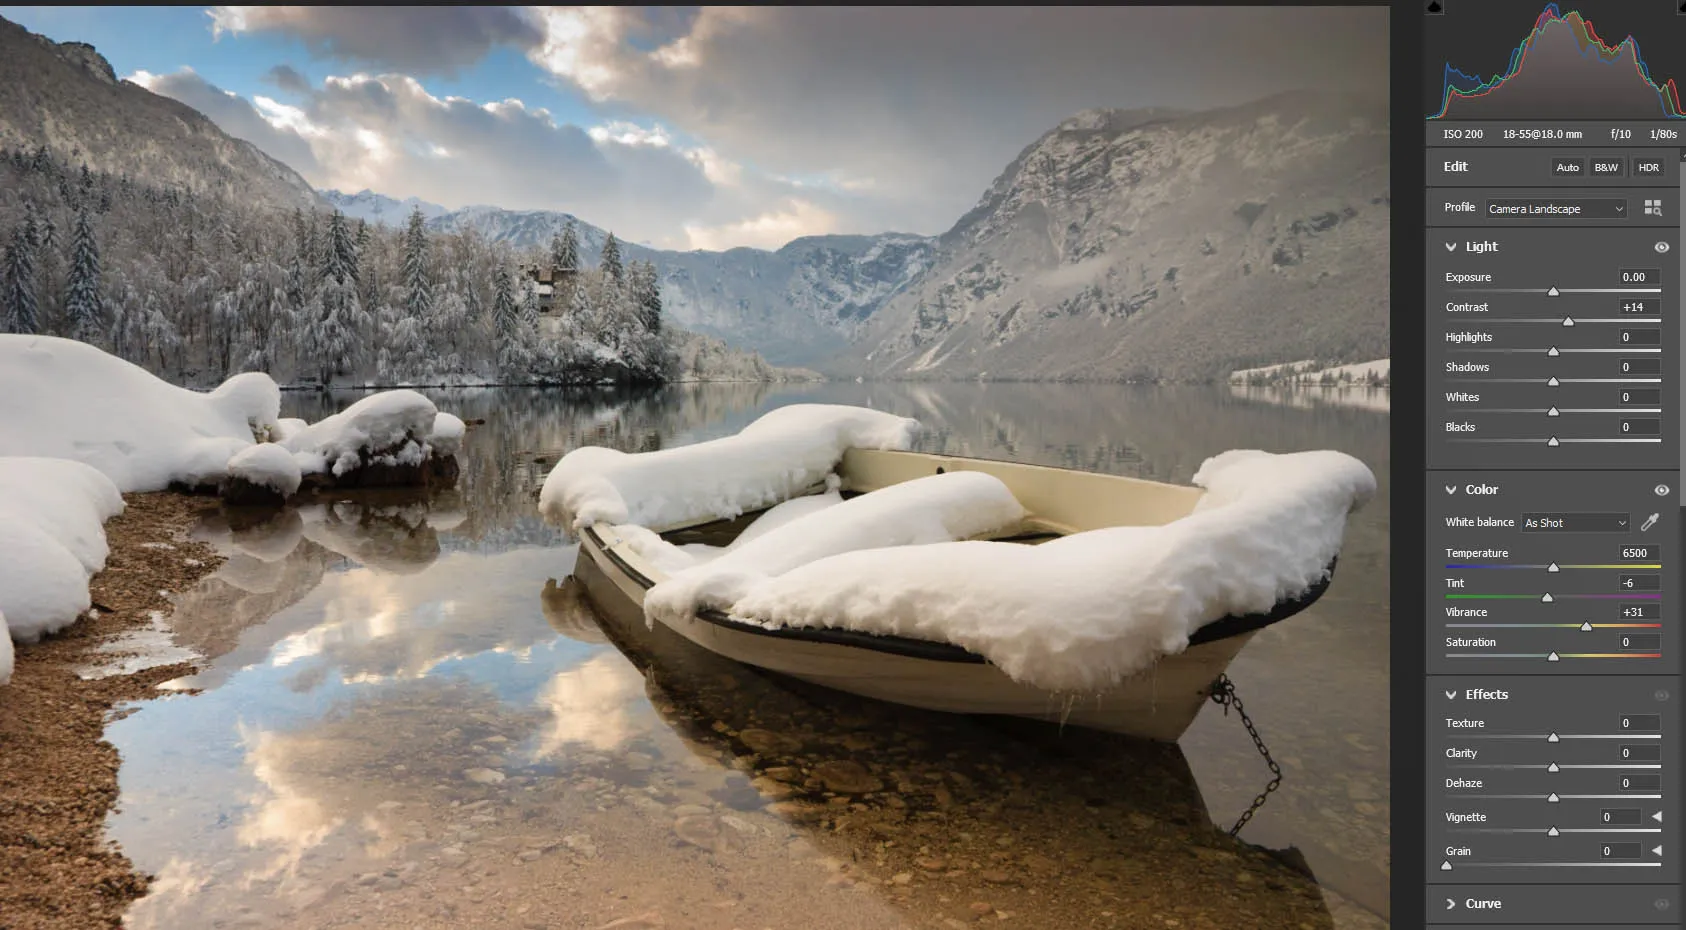
For a typical scene, a correctly exposed image will usually show a histogram that:
- Has no hard spikes against the right edge (no blown highlights)
- Has no hard spikes against the left edge (no crushed shadows, unless intended)
- Shows a gradual, rounded distribution spread across the tones
- Doesn’t bunch entirely at one end of the graph
What Is ETTR (Expose to the Right)?
ETTR — Expose to the Right — is a technique that uses the histogram to maximise the data captured in a RAW file. The idea is to push your exposure as far to the right as possible — making the image as bright as it can be — without tipping over into highlight clipping.
Why does this help? Digital sensors capture significantly more tonal data in the brighter half of the exposure range. A brighter exposure (histogram sitting closer to the right) results in cleaner shadow detail, less digital noise, and more flexibility in post-processing. For landscape, studio, and macro photographers shooting RAW, ETTR is one of the most useful techniques available.
To apply ETTR accurately, you need a live histogram that updates in real time as you adjust your exposure — not an after-the-fact review of a shot you’ve already taken.
The Live Histogram in Shutter+
Shutter+ includes a real-time histogram that updates continuously as you compose your shot, giving you an accurate readout of your exposure before you press the shutter. As you adjust your shutter speed, aperture, ISO, or exposure compensation, the histogram responds immediately — showing you the effect of every change as it happens.
The histogram sits unobtrusively in the corner of the live view screen, always visible without obscuring your composition. You can resize it and toggle it on or off at any time. It works alongside every other Shutter+ overlay — zebra stripes, false colour, focus peaking, and composition grids — so you can build exactly the monitoring workflow you need.
Why Viewing the Histogram on iPhone or iPad Beats Your Camera Screen
There is a fundamental practical problem with reading your histogram on your camera’s built-in display: the screen is simply too small.
Your camera’s rear LCD is typically around three inches — designed for menu navigation, not precision exposure monitoring. Many cameras only show a histogram in image review mode, which means you see it only after the shot has already been taken. By then, the light may have changed or the moment may have passed.
Shutter+ runs on your iPhone or iPad, which changes the histogram experience entirely. Your live histogram is displayed on a screen that is:
- Dramatically larger — an iPhone screen is roughly twice the size of a typical camera LCD. An iPad Pro gives you over 11 inches. The histogram is readable at a glance.
- Brighter and optimised for outdoor conditions — iPhone and iPad screens are engineered for real-world outdoor use, with peak brightness levels that make them readable in direct sunlight.
- Positioned in the corner without obstructing your image — in Shutter+, the histogram overlay sits in a small corner of the live view. On a large phone or tablet screen, this means full composition visibility alongside your exposure data simultaneously.
The result is that reading the histogram becomes a continuous, natural part of your shooting workflow rather than a deliberate interruption. That shift — from occasional checking to constant awareness — produces noticeably more consistent exposures across a shoot.
Using the Live Histogram for Video
The live histogram in Shutter+ is equally valuable when shooting video. Consistent, accurate exposure is even more critical in video than in stills — you can’t bracket-expose a moving scene. The histogram gives you a precise, real-time summary of your brightness distribution throughout a recording, and works alongside false colour and zebra stripe overlays to give you a complete exposure monitoring toolkit on your iPhone or iPad screen.
Quick Reference: Reading the Histogram
| What You See | What It Means | What to Do |
| Spike against the right edge | Highlight clipping — detail is lost in bright areas | Reduce exposure |
| Spike against the left edge | Shadow clipping — detail is lost in dark areas | Increase exposure (if detail is needed) |
| Distribution bunched to the left | Underexposure — image is too dark overall | Increase exposure |
| Distribution bunched to right (no spike) | Bright scene or deliberate ETTR — check highlights | Fine if no spike at the right edge |
| Gradual distribution across the middle | Well-balanced midtone exposure | Usually correct for general scenes |
| Spikes at both edges | Scene exceeds the sensor’s dynamic range | Consider exposure bracketing |
Summary
The histogram is the most reliable exposure tool in photography. Unlike your camera’s LCD, it doesn’t shift with ambient light. Unlike the image preview, it works in real time — before you’ve taken the shot. And unlike guesswork, it gives you objective data about exactly where your tones sit.
Understanding highlight clipping and shadow clipping is the foundation. Once you know what to look for at each edge of the histogram, you’ll catch exposure problems before they become lost shots — and techniques like ETTR become straightforward to apply rather than abstract concepts.
Shutter+‘s live histogram puts that data in front of you continuously, on a screen large enough to actually read it, positioned so it doesn’t get in the way of your image.
Ready to try it? Download Shutter+ on the App Store →
Frequently Asked Questions
What does a good histogram look like in photography?
There is no single correct shape — it depends entirely on the scene and your creative intent. However, for a typical, well-exposed scene, a good histogram will spread across the full tonal range without hard spikes pushing against either edge. The left and right walls should be clear, with the graph tailing off naturally before reaching them. A histogram bunched entirely to one end, or spiking off either edge, usually indicates an exposure problem worth addressing before shooting.
What does a spike on the right side of the histogram mean?
A spike against the right edge indicates highlight clipping — some pixels in your image have exceeded the maximum brightness the sensor can record and will appear as pure, textureless white. The larger the spike, the more extensive the clipping. To fix it, reduce your exposure until the spike falls away from the right edge. In Shutter+, you can watch the histogram respond in real time as you adjust exposure compensation.
What does it mean when the histogram is bunched to the left?
A histogram sitting almost entirely on the left side of the graph indicates underexposure — your image is too dark overall. If the graph also has a spike hard against the left wall, some shadow areas are clipping to pure black. To correct underexposure, increase your exposure by opening your aperture, slowing your shutter speed, raising your ISO, or dialling in positive exposure compensation.
Can you recover clipped highlights in post-processing?
Only partially, and with significant limitations. In a RAW file, very slight highlight clipping can sometimes be partially recovered using the Highlights slider in software like Lightroom or Capture One. However, severely clipped highlights — where pixels have truly maxed out at pure white — contain no tonal information and cannot be recovered. In a JPEG, even slight highlight clipping is generally unrecoverable. This is why preventing highlight clipping at the point of capture is so important.
What is ETTR in photography?
ETTR (Expose to the Right) is a shooting technique where you push your exposure as bright as possible — moving the histogram as far right as it can go — without tipping over into highlight clipping. The benefit is that digital sensors capture more tonal data in the brighter half of the exposure range, so a brighter exposure produces a RAW file with cleaner shadow detail, less noise, and more post-processing flexibility. The histogram is the essential tool for applying ETTR accurately.
Is it better to slightly overexpose or underexpose when shooting RAW?
Generally, slight overexposure (without clipping highlights) produces better results from a RAW file than slight underexposure. Underexposed shadows contain less tonal data and introduce more digital noise when lifted in editing. A slightly brighter exposure captures more information — as long as you protect the highlights. That said, in scenes with bright highlight areas such as snow, bright sky, or flames, it can be safer to err slightly toward underexposure to protect that detail, which is much harder to recover than lifted shadows.
Should you always avoid shadow clipping?
No. Shadow clipping is sometimes entirely intentional and appropriate. High-contrast black and white photography, dramatic portraits with dark backgrounds, and silhouette images often rely on pure black shadows for their visual impact. Shadow clipping only becomes a technical problem if you intended to retain detail in the areas that have clipped. The histogram lets you see exactly when and how much shadow clipping is occurring, so you can make an informed creative decision.
What is the difference between a luminance histogram and an RGB histogram?
A luminance histogram shows the overall tonal distribution as a single combined graph. An RGB histogram shows three separate graphs — one for each colour channel — allowing you to see whether individual channels are clipping even when the overall luminance looks balanced. For most exposure monitoring purposes, the luminance histogram is sufficient. But if you’re shooting scenes with strong, saturated colours, the RGB histogram gives you more complete information.
Why is my camera’s LCD screen unreliable for checking exposure?
Your camera’s rear LCD changes in apparent brightness depending on the ambient light around you. In a dark room, a correctly exposed image can look too bright and lead you to underexpose. In bright sunlight, the same image can look dim and lead you to overexpose. The histogram is immune to this — it shows the same objective data regardless of surroundings. This is also why viewing your live view on your iPhone or iPad with Shutter+ is more reliable: Apple’s displays have significantly higher peak brightness than typical camera LCDs and are designed specifically to remain readable in outdoor conditions.
How do I enable the histogram in Shutter+?
The histogram in Shutter+ can be toggled on or off directly from the live view screen. Once enabled, it appears as an overlay in the corner of the display and updates in real time as you adjust your exposure settings. You can also resize it to suit your preference. It works alongside all other Shutter+ overlays including zebra stripes, false colour, and focus peaking.
Related Articles