Histogram
The histogram shows the brightness distribution of the live view image in real time. It appears in the bottom left corner of the live view.
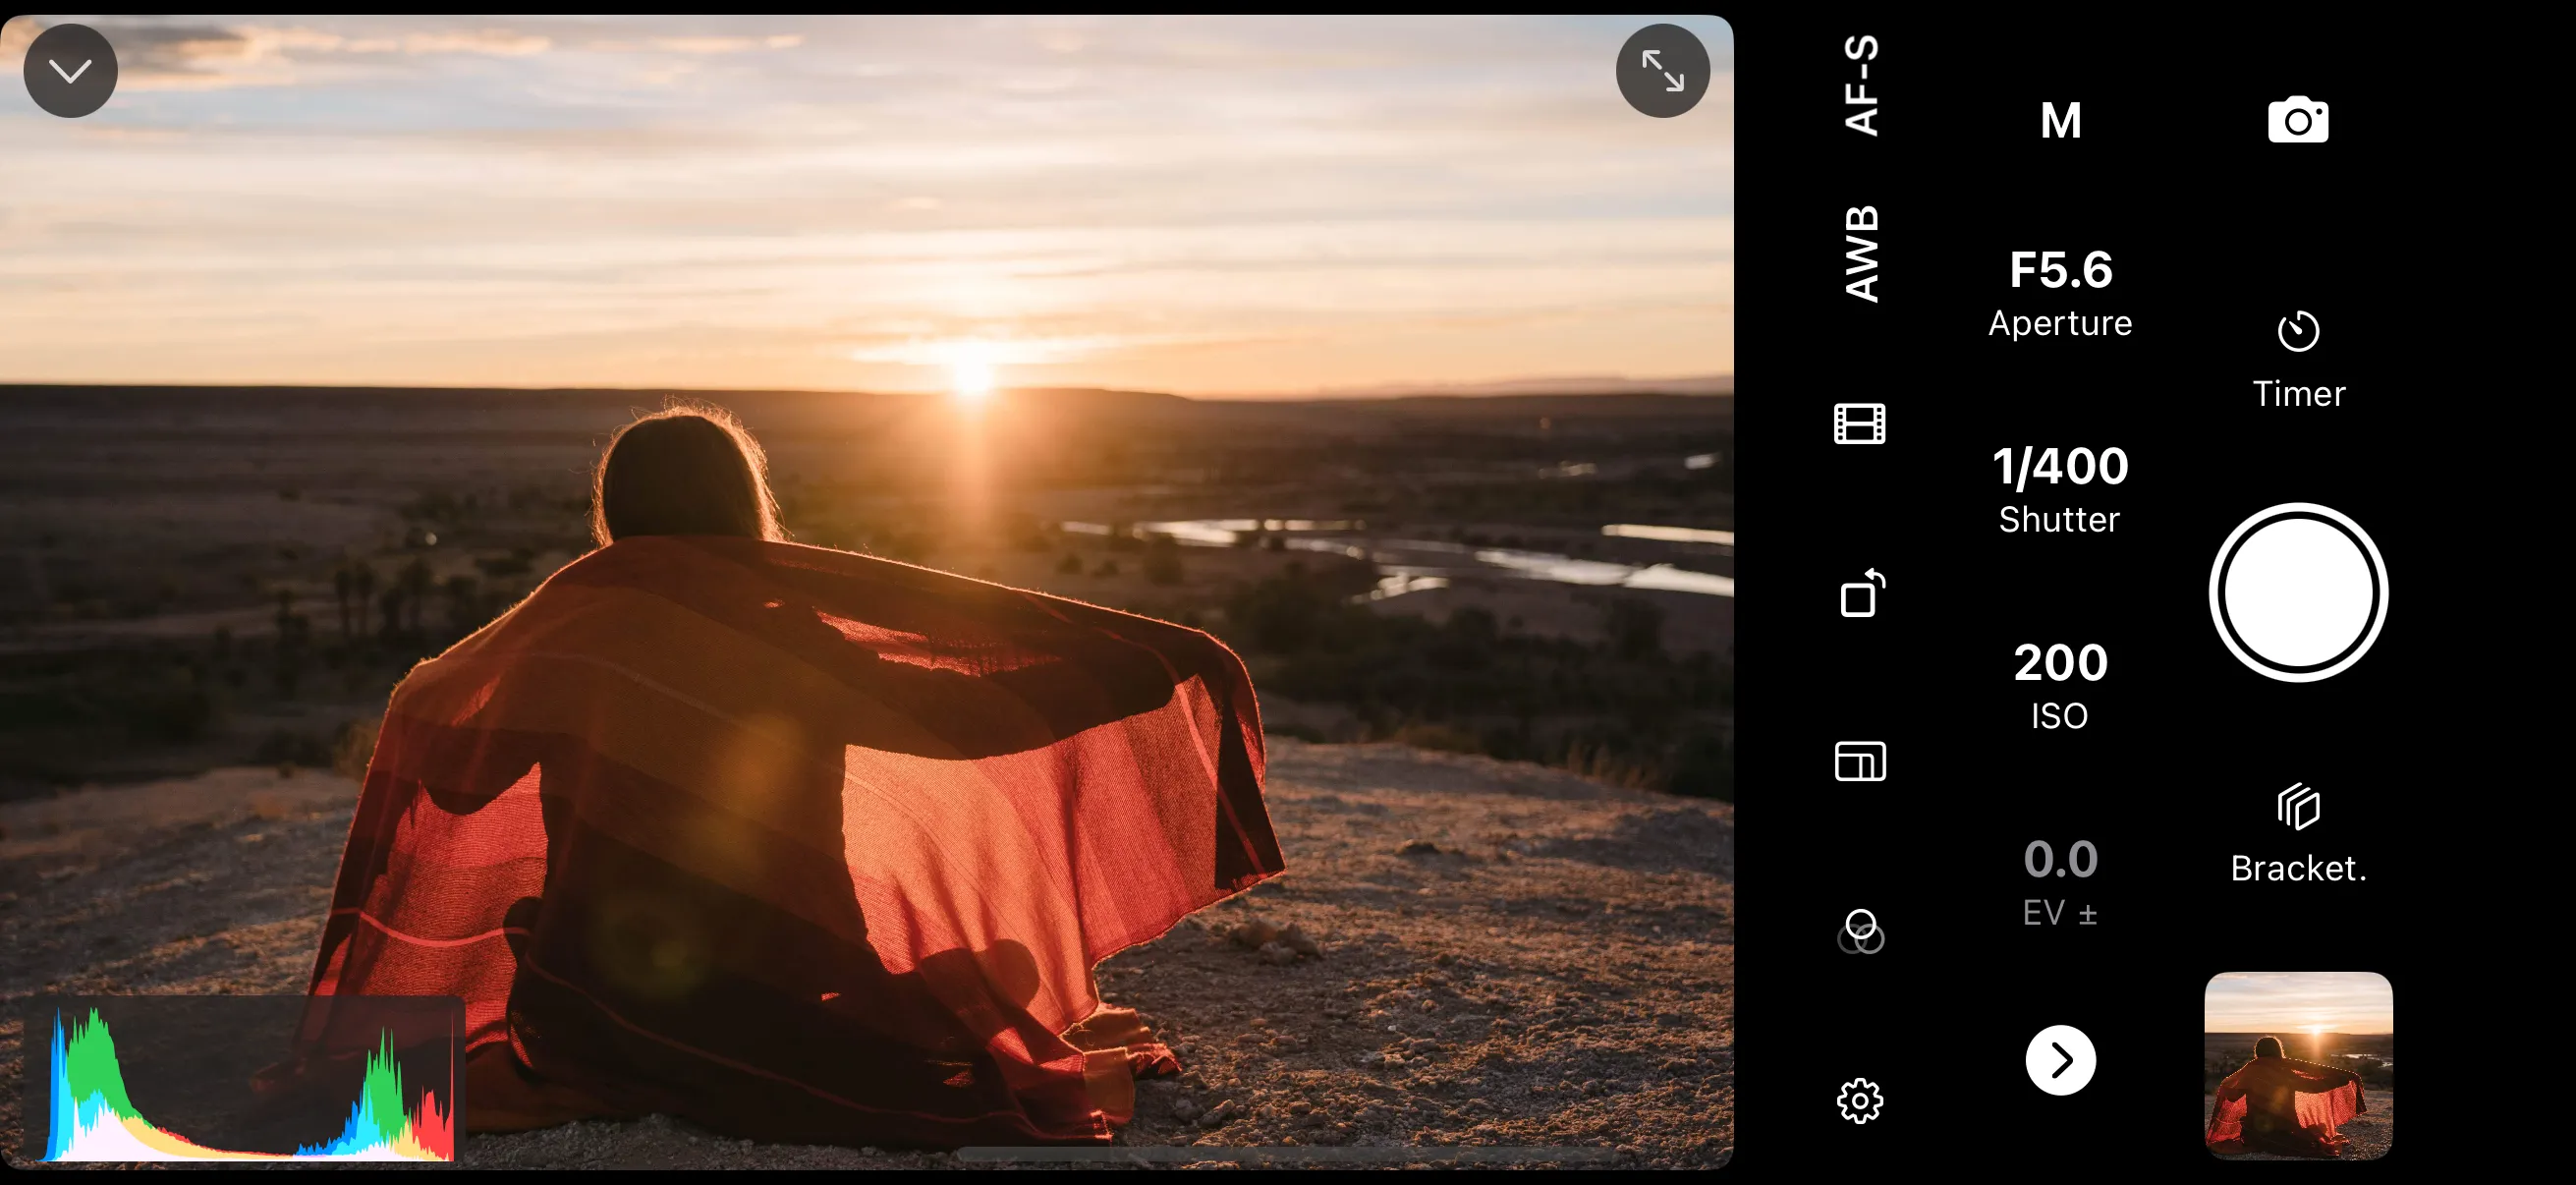
How to Read It
The horizontal axis represents brightness — dark tones on the left, bright tones on the right. The vertical axis shows how many pixels fall at each brightness level.
- Peaks on the left — the image has a lot of dark tones. If the graph is pushed against the left edge, shadows may be clipped (detail lost in dark areas).
- Peaks on the right — the image has a lot of bright tones. If the graph is pushed against the right edge, highlights may be blown (detail lost in bright areas).
- Spread across the graph — the image uses a wide range of tones.
Enabling the Histogram
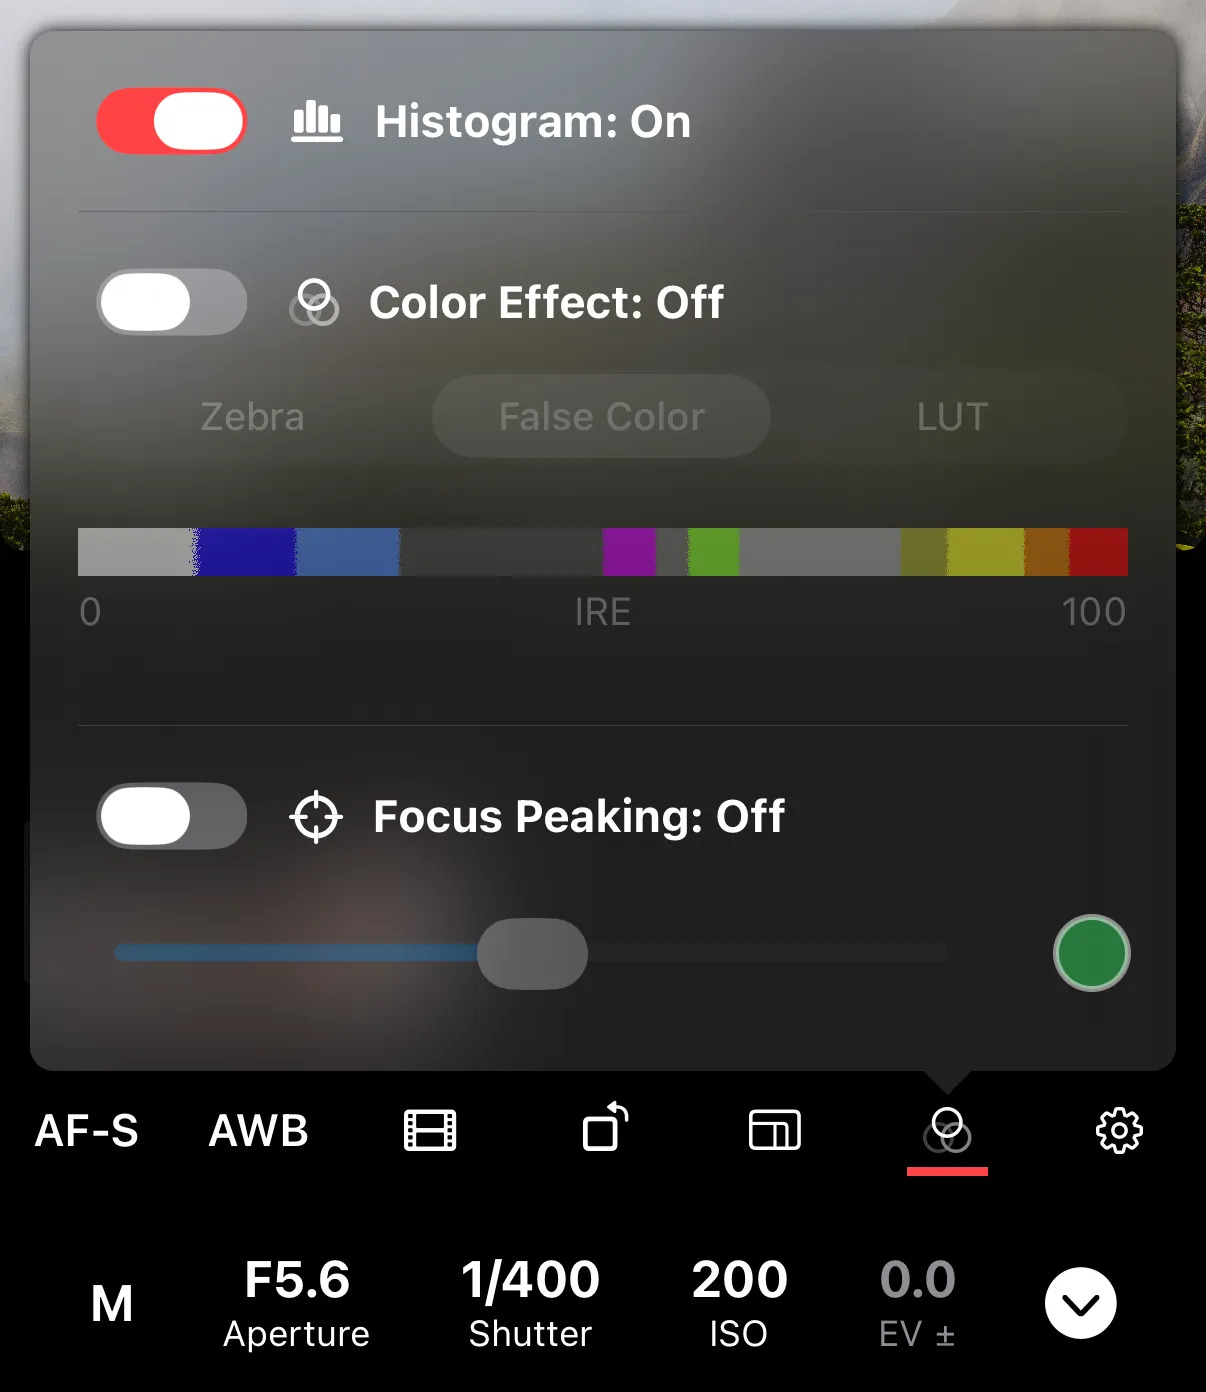
Toggle the histogram in the exposure aids settings.
The histogram works independently of color effects — it stays visible whether you’re using zebra stripes, false color, LUT preview, or none of them.
Resizing the Histogram
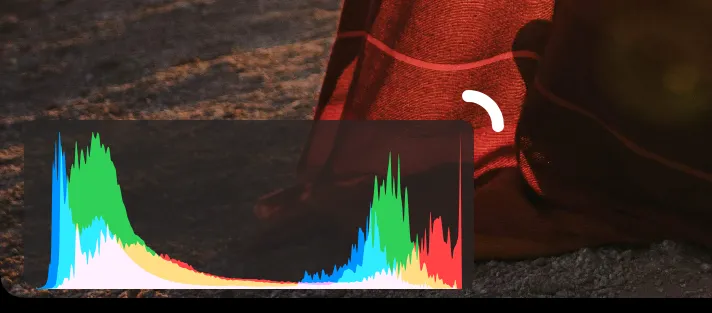
To resize the histogram, tap on it first to reveal a resize handle. Drag the handle to get the desired histogram size.